
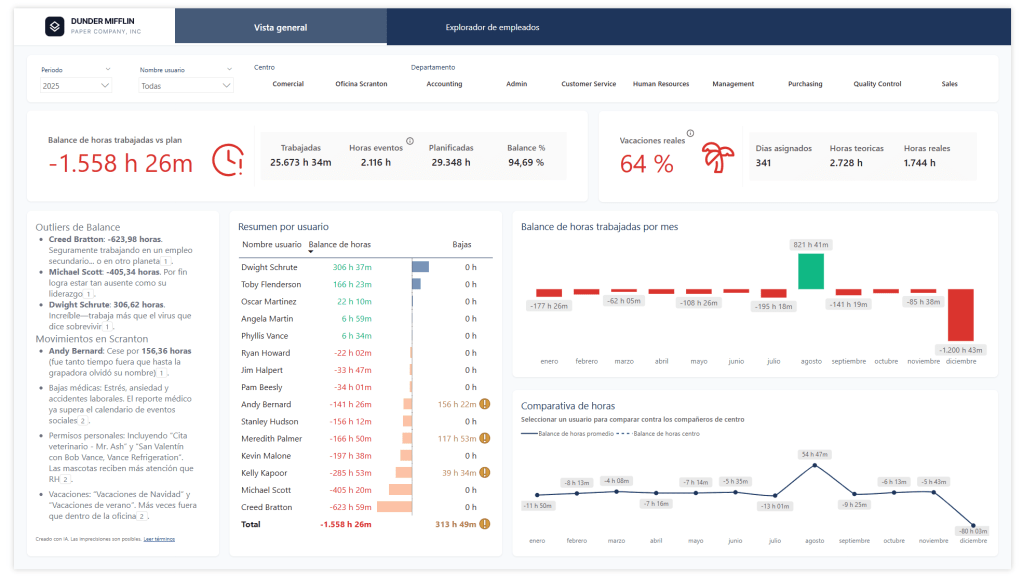
A few weeks ago I entered a Power BI dashboard design contest. The dataset? A fictional HR model for Dunder Mifflin yes, the paper company from The Office.
I didn’t win. But honestly? I walked away with more than I expected. The thing about these kinds of projects is that they push you the same way real work does — you hit a wall, you figure it out, and somewhere in that process you go deeper on something you’d been meaning to explore for months. The constraints aren’t a limitation, they’re the point.
And sometimes the best learning happens under a deadline you didn’t need to take on.
This post is the first in a series where I’ll break down everything I explored during that contest. Think of it as a post-mortem with practical takeaways.
What’s Coming in This Series
Here’s what I’ll be covering across the upcoming posts:
- AI Prototyping with Google Stitch
Before touching Power BI Desktop, I prototyped the dashboard visually using Google Stitch. It changed how I approach the design phase entirely. - The New Card Visual
Microsoft’s redesigned Card visual is more powerful than it looks at first glance. I pushed it further than I expected and picked up some patterns worth sharing. - HTML Visuals with AI-Assisted Development
I used AI to accelerate the development of custom HTML visuals — iterating on layouts, styling, and logic faster than ever. I’ll walk through my workflow and what actually worked. - DAX User-Defined Functions for Format Strings
One of my favourite finds from this project: centralising format strings using DAX user-defined functions, so you’re not scattering the same format logic across dozens of measures.
Why a Fictional HR Dataset Is Actually Great for Learning
Working with Dunder Mifflin data has a hidden advantage — you already know the characters, the branches, the dynamics. That familiarity lets you focus entirely on the craft of the report rather than spending mental energy understanding the business domain.
It’s the same reason tutorials use Northwind or AdventureWorks. Familiar data removes friction. And honestly, it makes the whole thing a lot more fun — nobody gets excited about Generic Company Inc.
Follow Along — Report on GitHub
I’ve published the report file on GitHub. Whether you want to follow the series with the actual .pbix in hand, poke around the data model, or just see how everything fits together — it’s all there. Each post in the series will reference specific parts of the file, so having it open alongside the articles is a good idea.
Before you open the report
Make sure DAX User Defined Functions are enabled in Power BI Desktop’s Preview Features. The report won’t load without it. Here’s how to turn it on →

Deja un comentario